May 15 officially marked the start of the 2016 rate review season. What that means for Americans is that over the next month or so, newspapers and web sites across the country will start running stories with scary-sounding headlines like this:
Some Oregonians could face major insurance rate hikes next year
Health plans request double-digit premium increases
... or, more reassuringly, like this:
Lower rate increases, more plans proposed
for state's health exchange in 2016
The articles will throw a bunch of numbers around, saying that the "average" premium rate increase for a given state is expected to be X percent, followed by examples of the highest and lowest increases. There may even be a few "Company Y will actually be reducing their rates!" thrown in.
Before you freak out, there are a few important things to look for.
1. Market share matters
Is the "average" number weighted by provider market share?
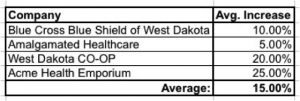
To simplify things, let's use the made-up state of "West Dakota," where precisely 100,000 people enrolled in private qualified health plans (QHPs) this year, either on or off the exchange. West Dakota has three insurance companies operating on the ACA exchange, plus one more offering individual policies off-exchange only. According to the phantom headline in the local paper, WD is facing a 15 percent average rate hike next year, which sounds pretty bad.
However, what if the reporter got 15 percent by simply adding up the average increases from all of the companies and divide them by four?

If all four companies happened to have exactly 25,000 enrollees apiece, this would be reasonable. However, many states are dominated by one or two companies, and even if they aren't, the relative market share is rarely split up evenly. In the case of West Dakota, BCBSWD snapped up 60 percent of the enrollees and Amalgamated Healthcare grabbed another 30 percent, with the remaining 10,000 split evenly between the CO-OP and Acme. Here's what the weighted average looks like:

Huh. Only 9.75 percent. Not great, but much better than 15 percent, and no longer in "double-digit" range.
Of course, this can also work the other way. Here's a real-world example: Last year, the Detroit Free Press reported that the average rate increase for Michigan residents would only be 0.8 percent, which would have been awesome! Unfortunately, as you can see at the link above, two companies with a combined 74 percent market share asked for 9.7 percent and 9.3 percent increases respectively. The actual weighted average increase for all of the companies? 9.4 percent.
2. Metal levels, too
Is the "average" further weighted by metal level?
But wait, there's more! Each of those companies offers policies at different Metal Levels (Bronze, Silver, Gold and Platinum), plus Catastrophic in most cases ... and just as the market share between companies is never split evenly, that's also true of the metal levels.
A typical breakout might be something like 60 percent Silver, 20 percent Bronze, 10 percent Gold, 5 percent Platinum and 5 percent Catastrophic ... and if each of those increased by the same amount, it wouldn't matter.
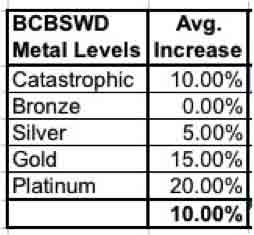
But what if BCBSWD decided to only increase Silver rates slightly, while increasing the other metal levels by higher amounts (or not at all)? Again, if you just add these up and divide by five you do indeed get a 10 percent increase:

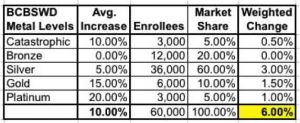
However, when you run a weighted average within this company itself, you get:

... a mere 6 percent average increase! That, in turn is the number which needs to be plugged into the "weighted by company market share" table. You also have to do this for the other companies as well.
For simplicity's sake, let's assume that nothing changes for the other three companies. Even so, BCBS's adjustment alone reduces the "true" weighted average further, from 9.75 percent down to just 7.35 percent:

Again, this can also work both ways.
3. Consider actual dollar amounts
What are the actual old and new dollar amounts that we're talking about here?
Remember, until now we've been talking purely about percentages ... but that can be very misleading. In our hypothetical example, Acme is a new player on the market. They priced aggressively last year in order to steal customers away from the more familiar brand names, and managed to get 5 percent of the market; not bad.
Unfortunately, those customers turned out to be loss leaders – it's costing them more to care for their enrollees than they're being paid, so they jacked up their rates 25 percent this year, while Blue Cross is only raising theirs 6 percent (weighted).
HOWEVER, when you look at the average premium dollar amounts of each company, look what happens:
- Blue Cross avg. premium: $400/month + 6 percent = $424/month
- Acme avg. premium: $300/month + 25 percent = $375/month
Acme is still offering cheaper rates than Blue Cross, even with a 25 percent rate hike!
With real companies in real states, the situation is far more complicated. Some states have up to 20 companies operating on the exchange, off the exchange or both. Most companies have far more than just one policy per metal level; some are offering 20 or 30. Most of those plans have different deductible levels, co-pays, out-of-pocket maximums and so on.
4. Requested rates? or approved?
Are these numbers requested rate increases or approved??
When you read these articles, especially over the early part of the summer (June/July), be on the lookout for clarifiers like "requested" rate increase and "Company X is hoping to receive ... " such-and-such rate hike. These requested rate changes are being submitted to the state insurance commissioner's office ... and in most states either the commissioner or some other regulatory body has to either approve the requests or deny them.
If denied, they might assign different (generally lower) increases, or they may even tell the company to resubmit their request at a lower rate. Remember, you can ask for anything you want ... that doesn't mean you're gonna get it.
The difference this factor makes can be striking. Here's what really happened in Rhode Island last year, where BCBSRI had a virtual lock on the market in 2014 (98 percent): They asked for an 8.9 percent rate hike but were only approved for 4.5 percent. That's right: Their rate spike was slashed in half.
Connecticut was even more dramatic: The requested increase was around 12.8 percent; the approved increase was just 3.1 percent.
Unfortunately, in some states, the law doesn't allow the insurance commissioner actual veto power over rate hikes; they can make recommendations and scream about excessive gouging, but that's about it. In other states, the commissioner may not bother overriding the company requests. In still others, they may crunch the numbers and agree that yes, the requested rate changes are reasonable. The approved rate changes should start to be reported sometime in late July/early August.
The point of all this is that when you see a shockingly high 2016 rate hike splashed across a headline, take it with a huge grain of salt. It may be accurate, or it may turn out to be much ado about very little.
As for me, I can usually only take things past the first question above (weighted by company market share). Beyond that, it would take an insane amount of time to comb through the dozens of individual plans for every company in every state ... but weighting by market share at least cuts down on one of the variables.
When all bets are off
Of course, if the Supreme Court decides to blow up the entire system with an adverse King v. Burwell decision, all bets are off, as none of the "requested" rate changes will have any meaning whatsoever in the 34 states without their own exchange. Why?
If the King plaintiffs win, that would likely mean that federal tax credits would be cut off to up to 7 million people across those states. Since the credits are the only thing making their policies affordable, just about all of those people would have to drop their policies.
That, in turn, would mean that the only ones left with their policies would be the truly desperate – people with cancer, diabetes or other expensive-to-treat ailments or injuries. Since those folks would be so pricey to treat, the insurance companies would have to jack up their rates dramatically ... anywhere from 35 to 45 percent, according to the American Academy of Actuaries, which sent a letter to HHS Secretary Burwell back in February warning of exactly this outcome. And that's on top of whatever rate changes they were planning on in the first place.
In short, if the King plaintiffs win, prepare for one heck of a mess next year.
Charles Gaba is the founder of https://acasignups.net/, which has been live-tracking Obamacare enrollments since the exchanges launched in October 2013. His work has been cited by major publications from the Washington Post and Forbes to the New York Times as being the most reliable source available for up-to-date, accurate ACA enrollment data in the country.


